Theoretical Context
A periodic function y(x) with period T and angular frequency \omega=2\pi/T can be represented as a Fourier series:
\begin{equation*}
y(t)=A_0+\sum_{n=1}^\infty\big[A_n\cos(\omega nt) + B_n\sin(\omega nt) \big].
\end{equation*}
The Fourier coefficients A_0, A_n and B_n is given by:
\begin{align*}
A_0 &= \frac{1}{T}\int_{-T/2}^{T/2}\;y(t)\;dt,\\
A_n &= \frac{1}{T}\int_{-T/2}^{T/2}\;y(t)\;\cos(n\omega t)\;dt,\\
B_n &= \frac{1}{T}\int_{-T/2}^{T/2}\;y(t)\;\sin(n\omega t)\;dt.

\end{align*}
Note that the n-th term has frequency \omega_n\equiv n\omega. Displaying the Fourier coefficients A_0, A_n and B_n as function of frequencies \omega_n is known as the frequency spectrum.
In practice, taking the infinite sum is computationally impossible and one has to resort to computing the n-th partial sum y_n(t), which is obtained by truncating the Fourier series after n terms:
\begin{equation*}
y_n(t)\equiv A_0+\sum_{m=1}^n\big[A_m\cos(\omega mt) + B_m\sin(\omega mt) \big]
\end{equation*}
Making n larger and larger, the partial sum matches the actual function better and better. We will illustrate this with the example below.
Example
Consider the following periodic function:
\begin{equation*}
y(t)=\begin{cases}
-5 & \mathrm{for}\;-\pi < t < 0\\
+5 & \mathrm{for}\; 0 < t < \pi
\end{cases},
\end{equation*}
which 2\pi periodic so that the principle frequency \omega =1. Note that the function is odd, and therefore A_0=A_n=0. The coefficients B_n are non-zero only for n odd and are given by:
\begin{equation*}
B_n = \frac{10}{n\pi}\Big[1+(-1)^{n+1}\Big].
\end{equation*}
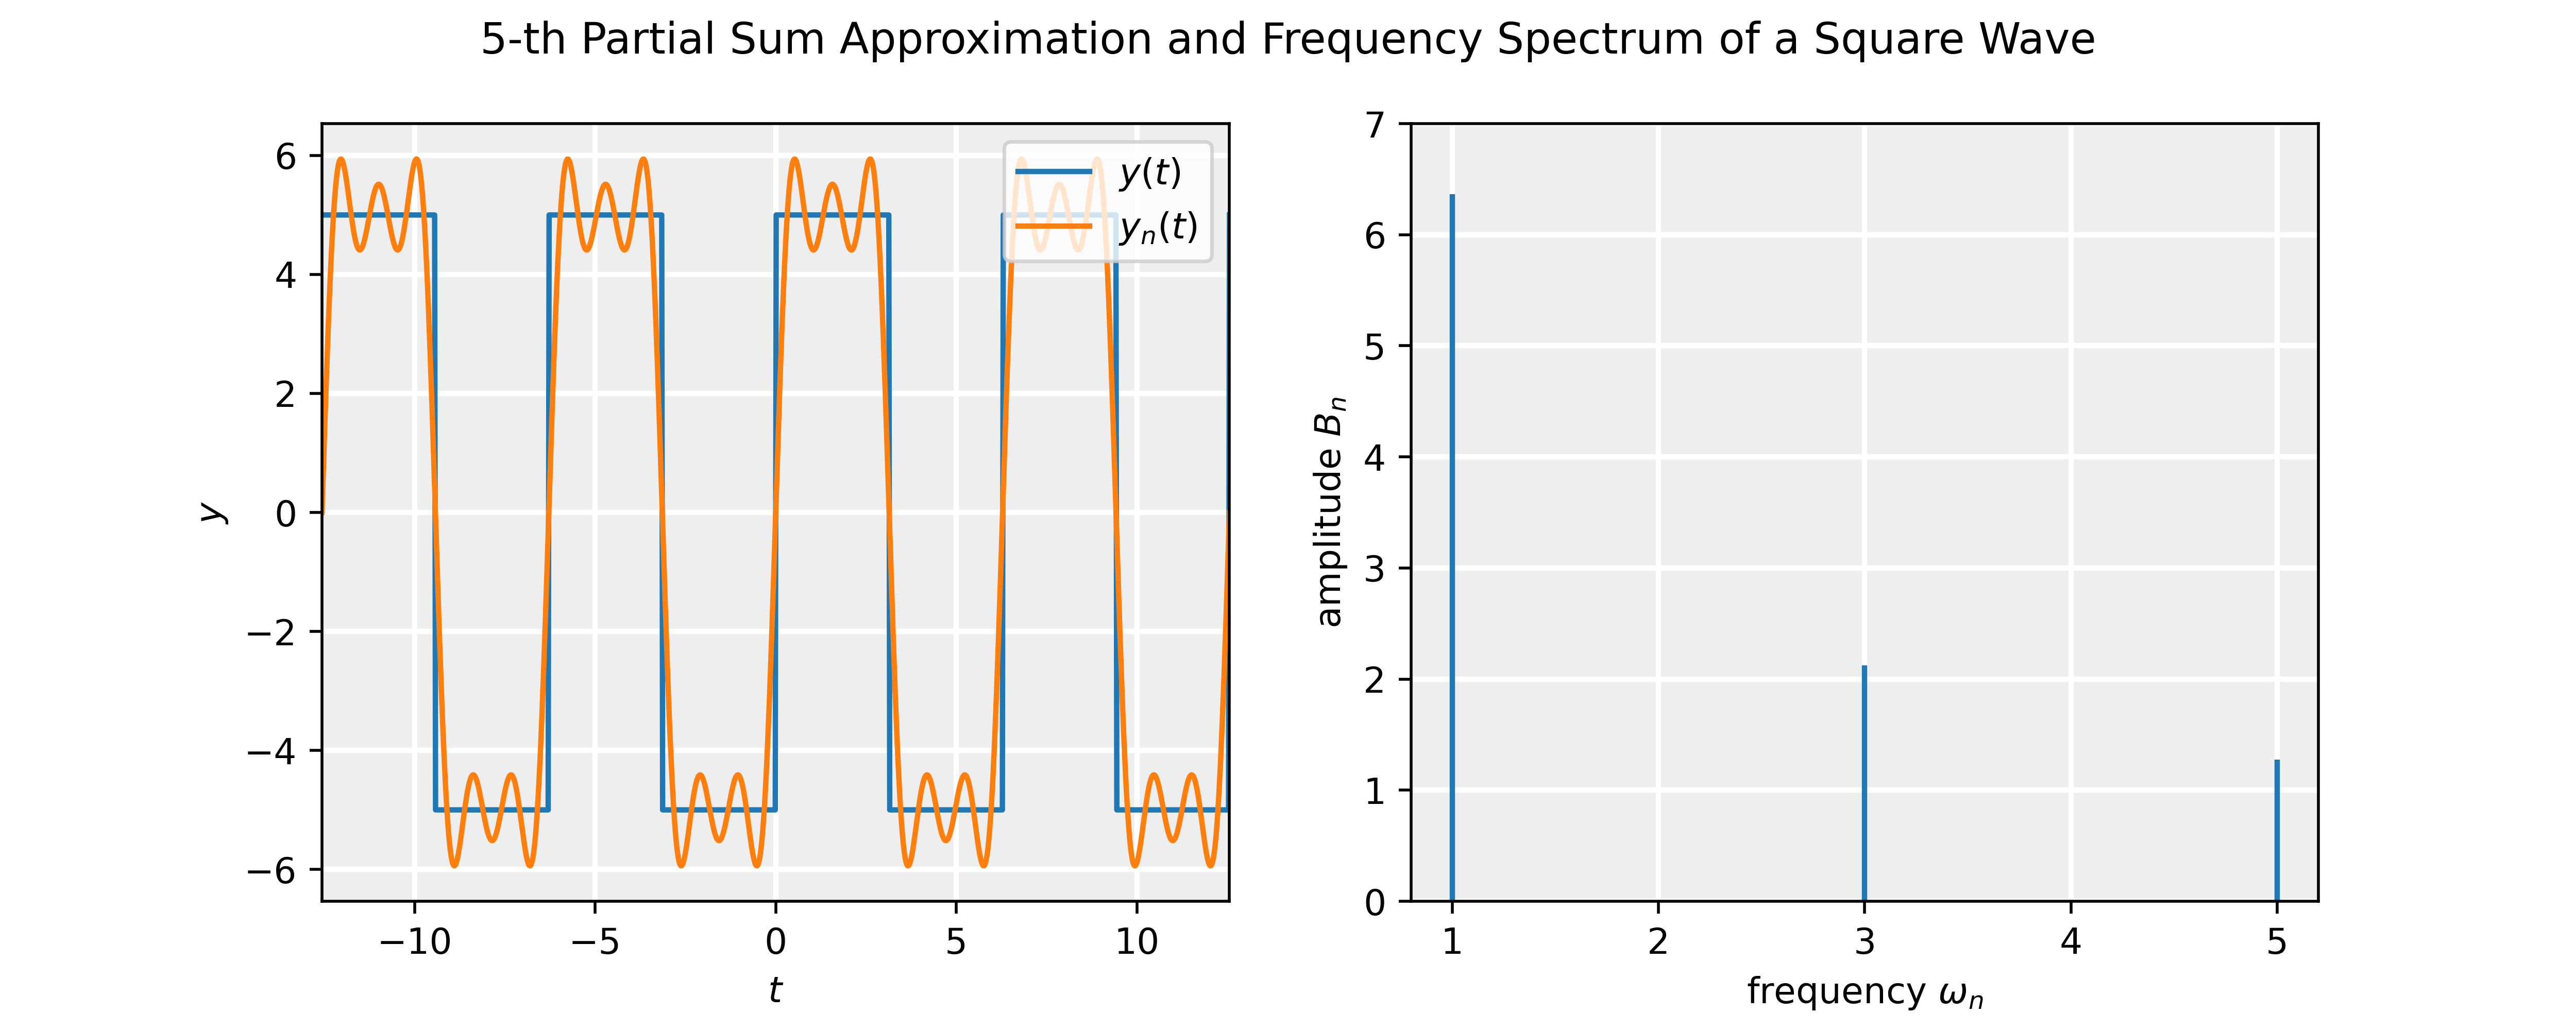
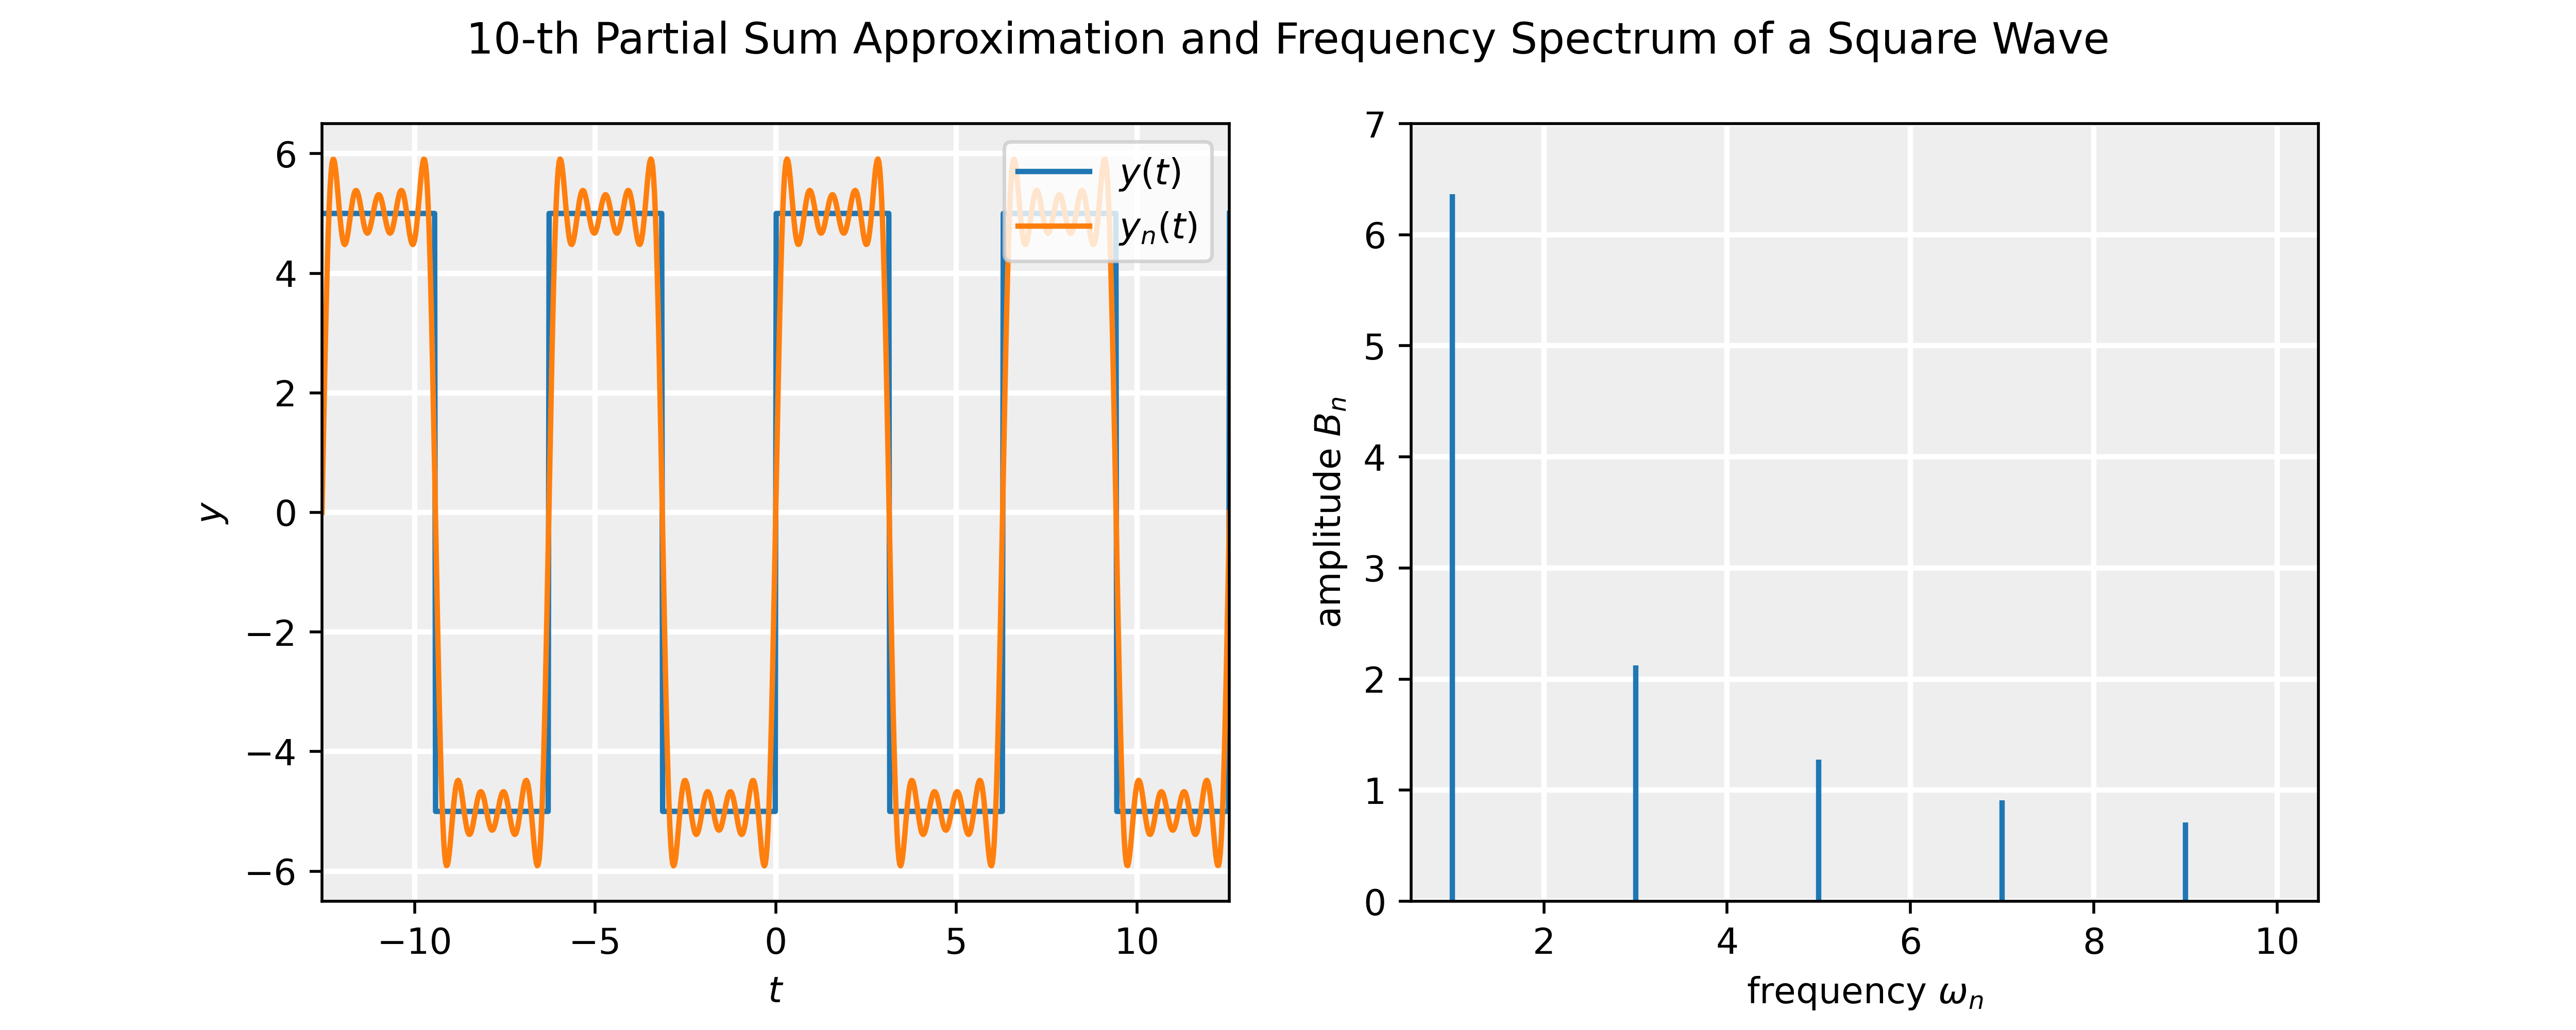
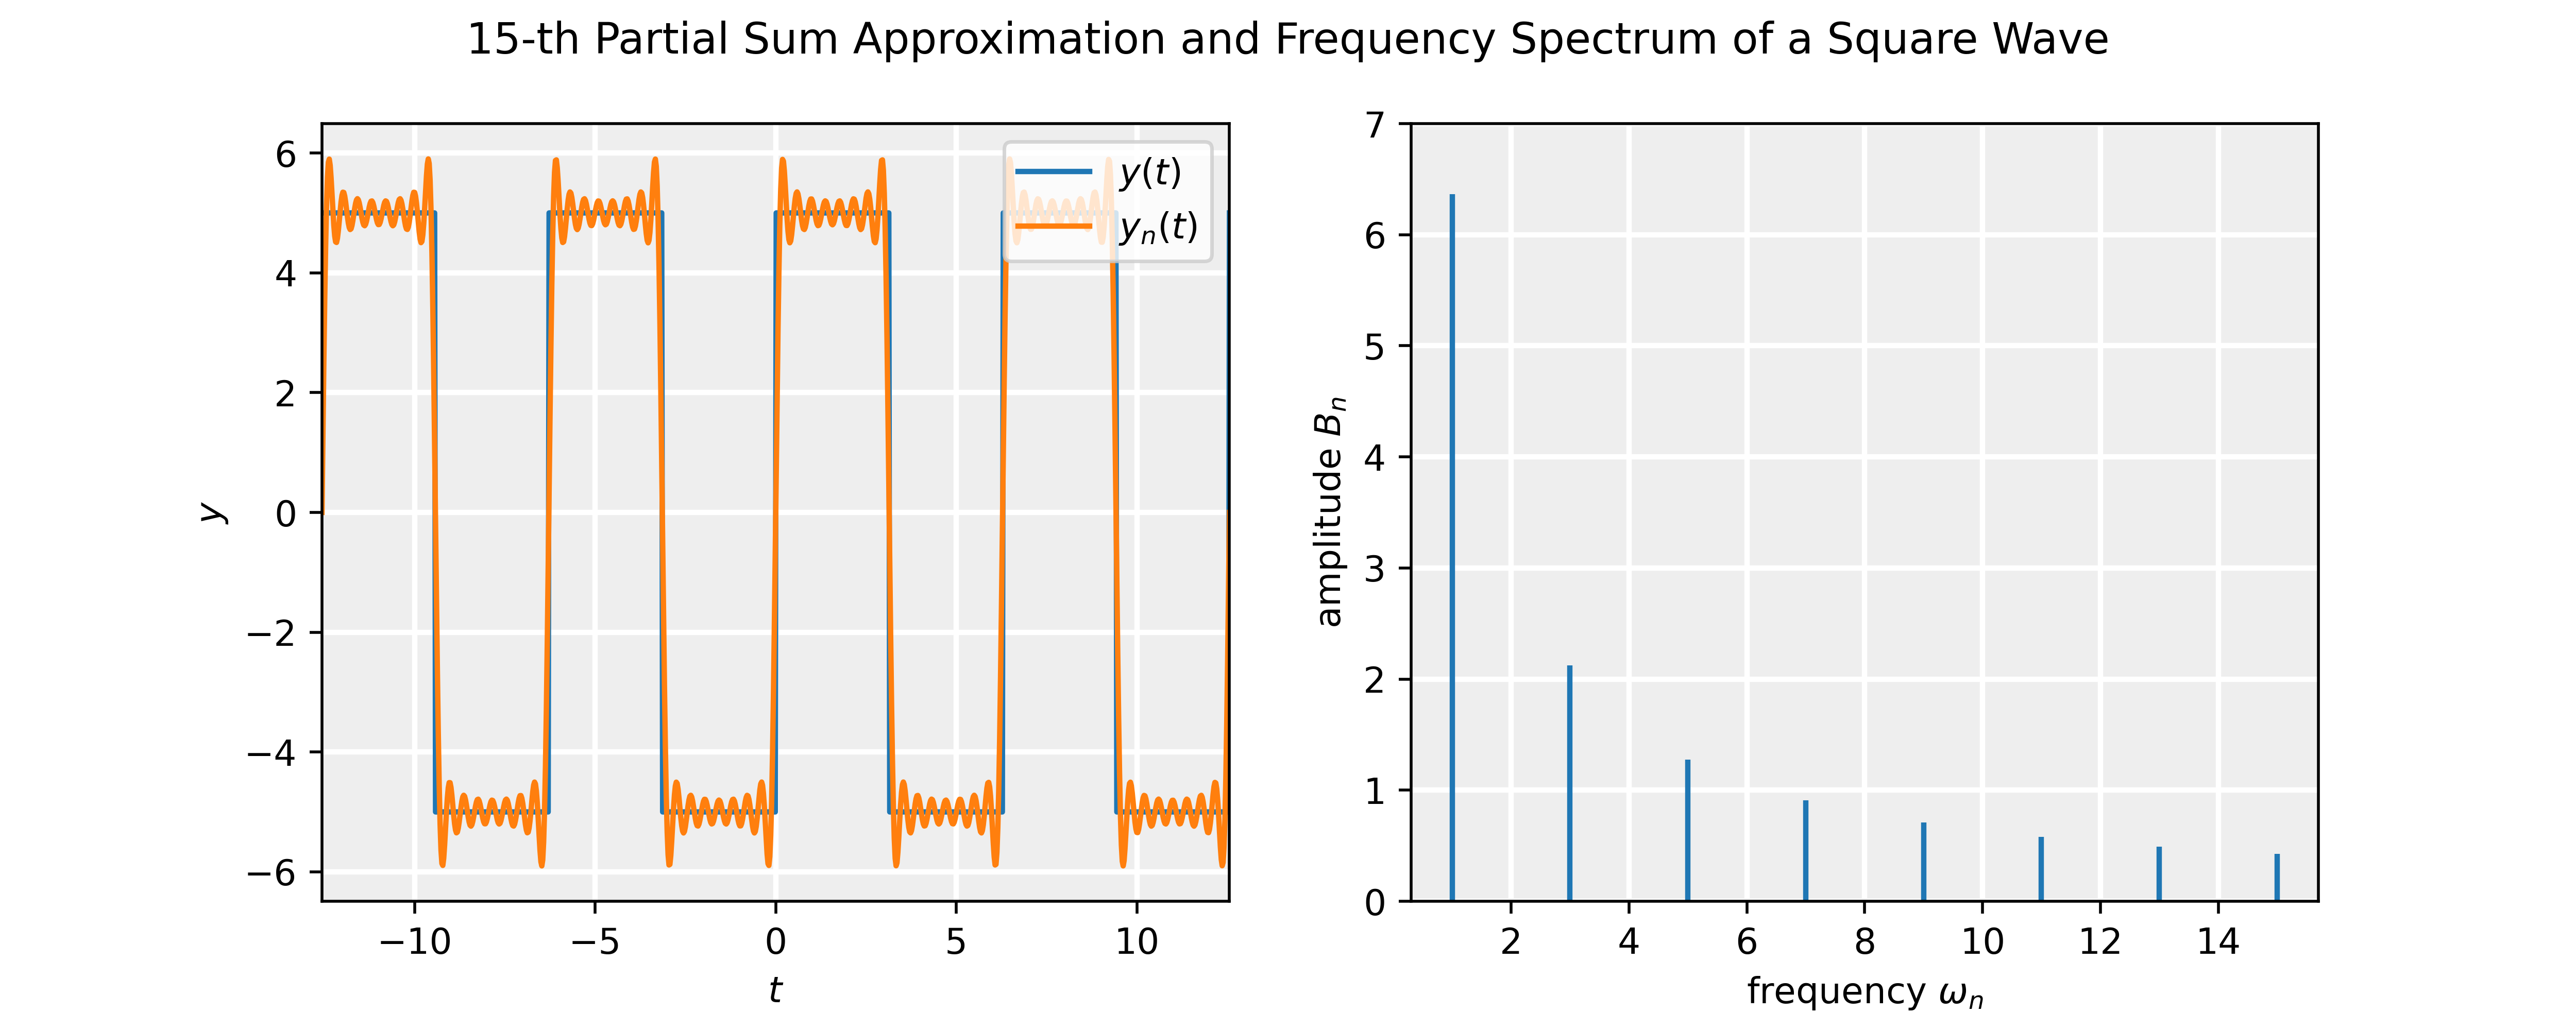
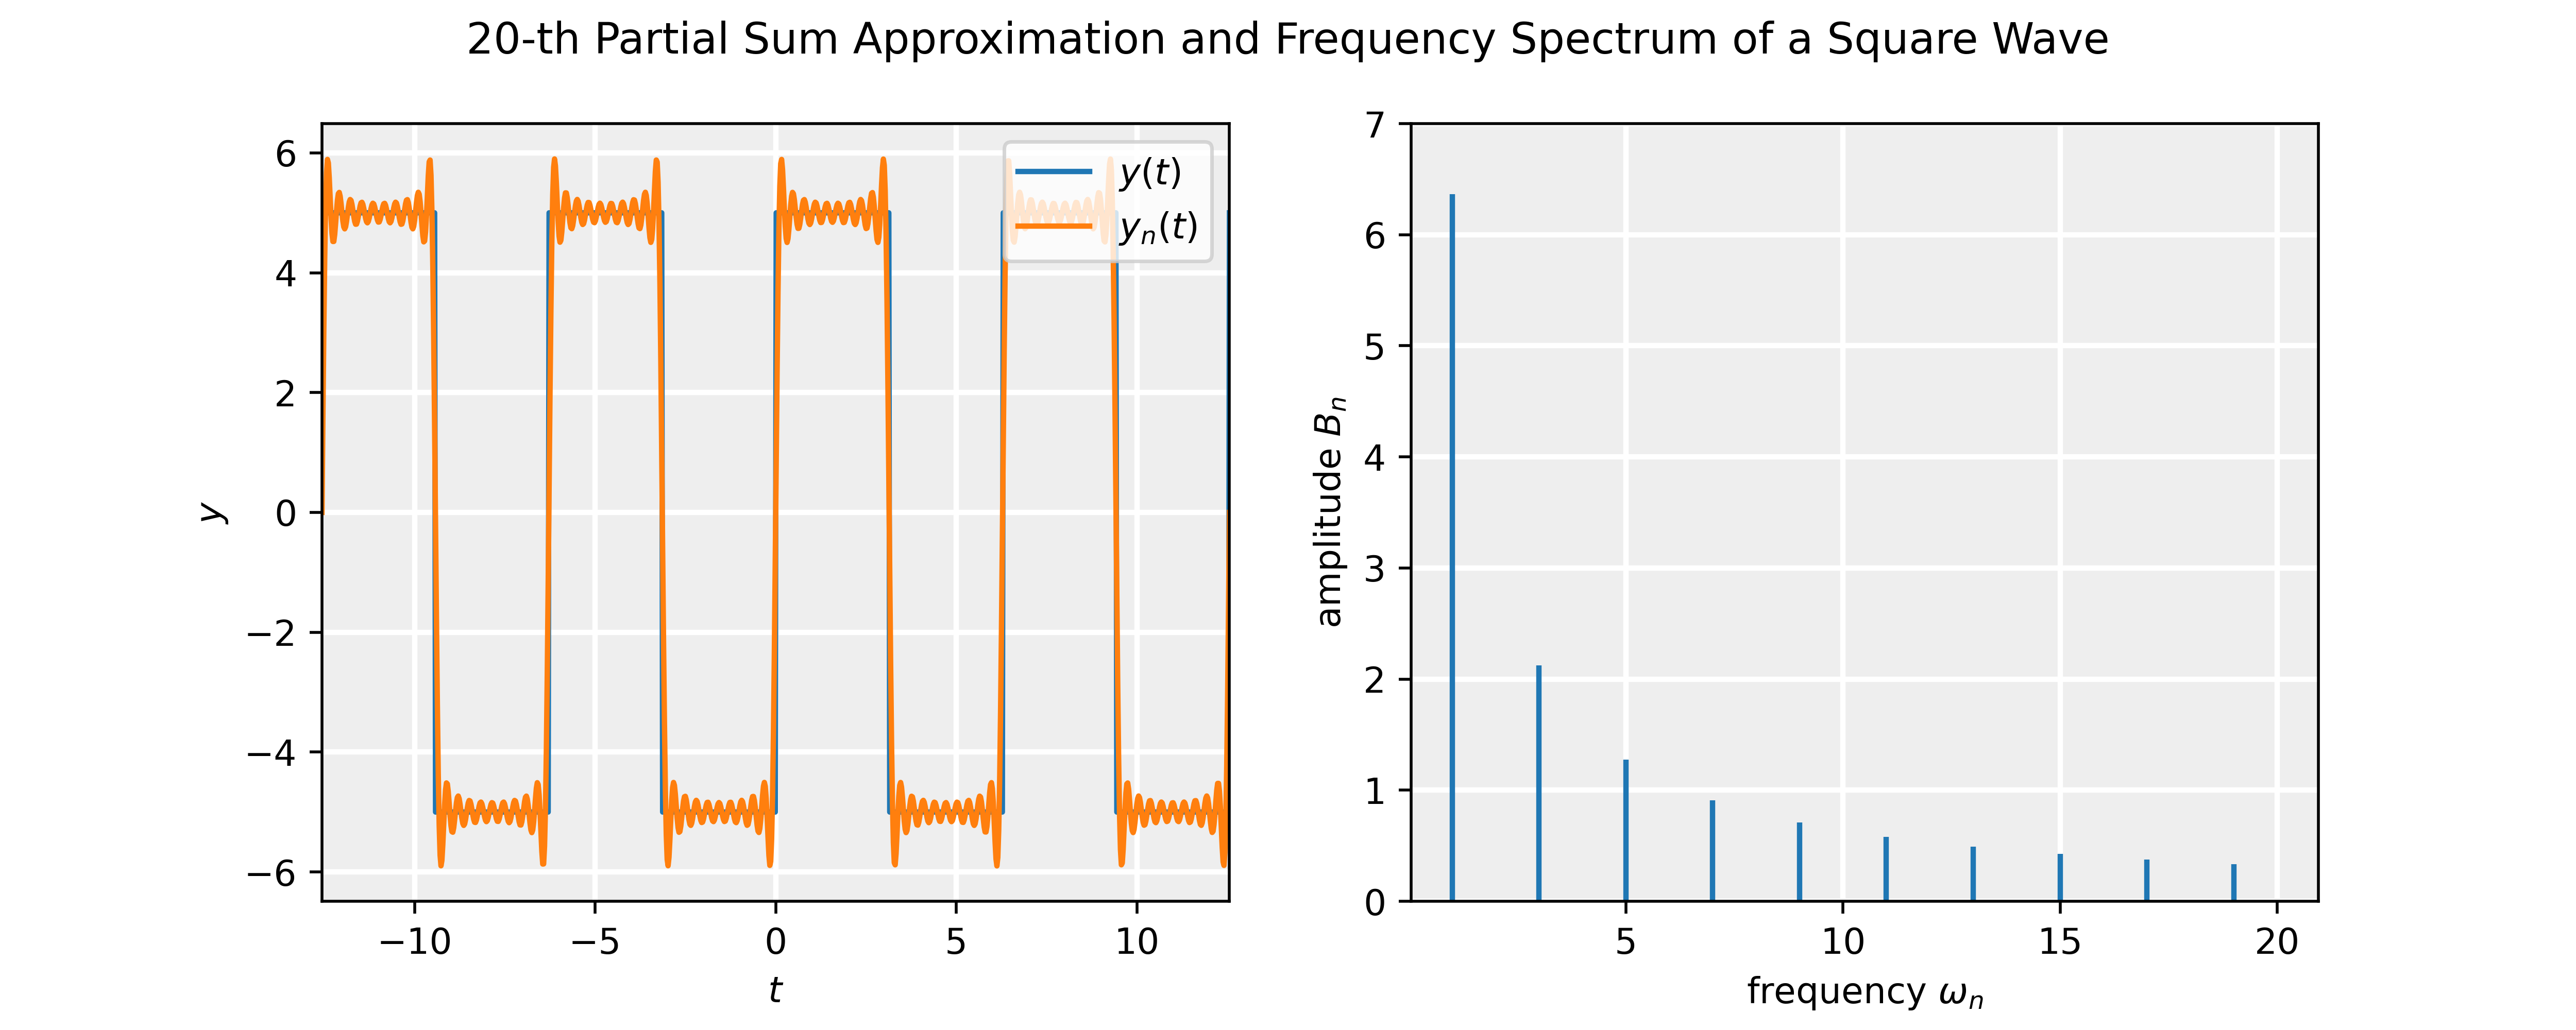
Partial Sum Approximation and Power Spectrum
The slideshow shows the partial sum approximation compared to the actual waveform and the corresponding power spectrum. The Jupyter notebook attached below allows one to interactively change the value of n in the partial sum using a slider, and check how the partial Fourier series and spectrum changes.


